Creating a Treemap
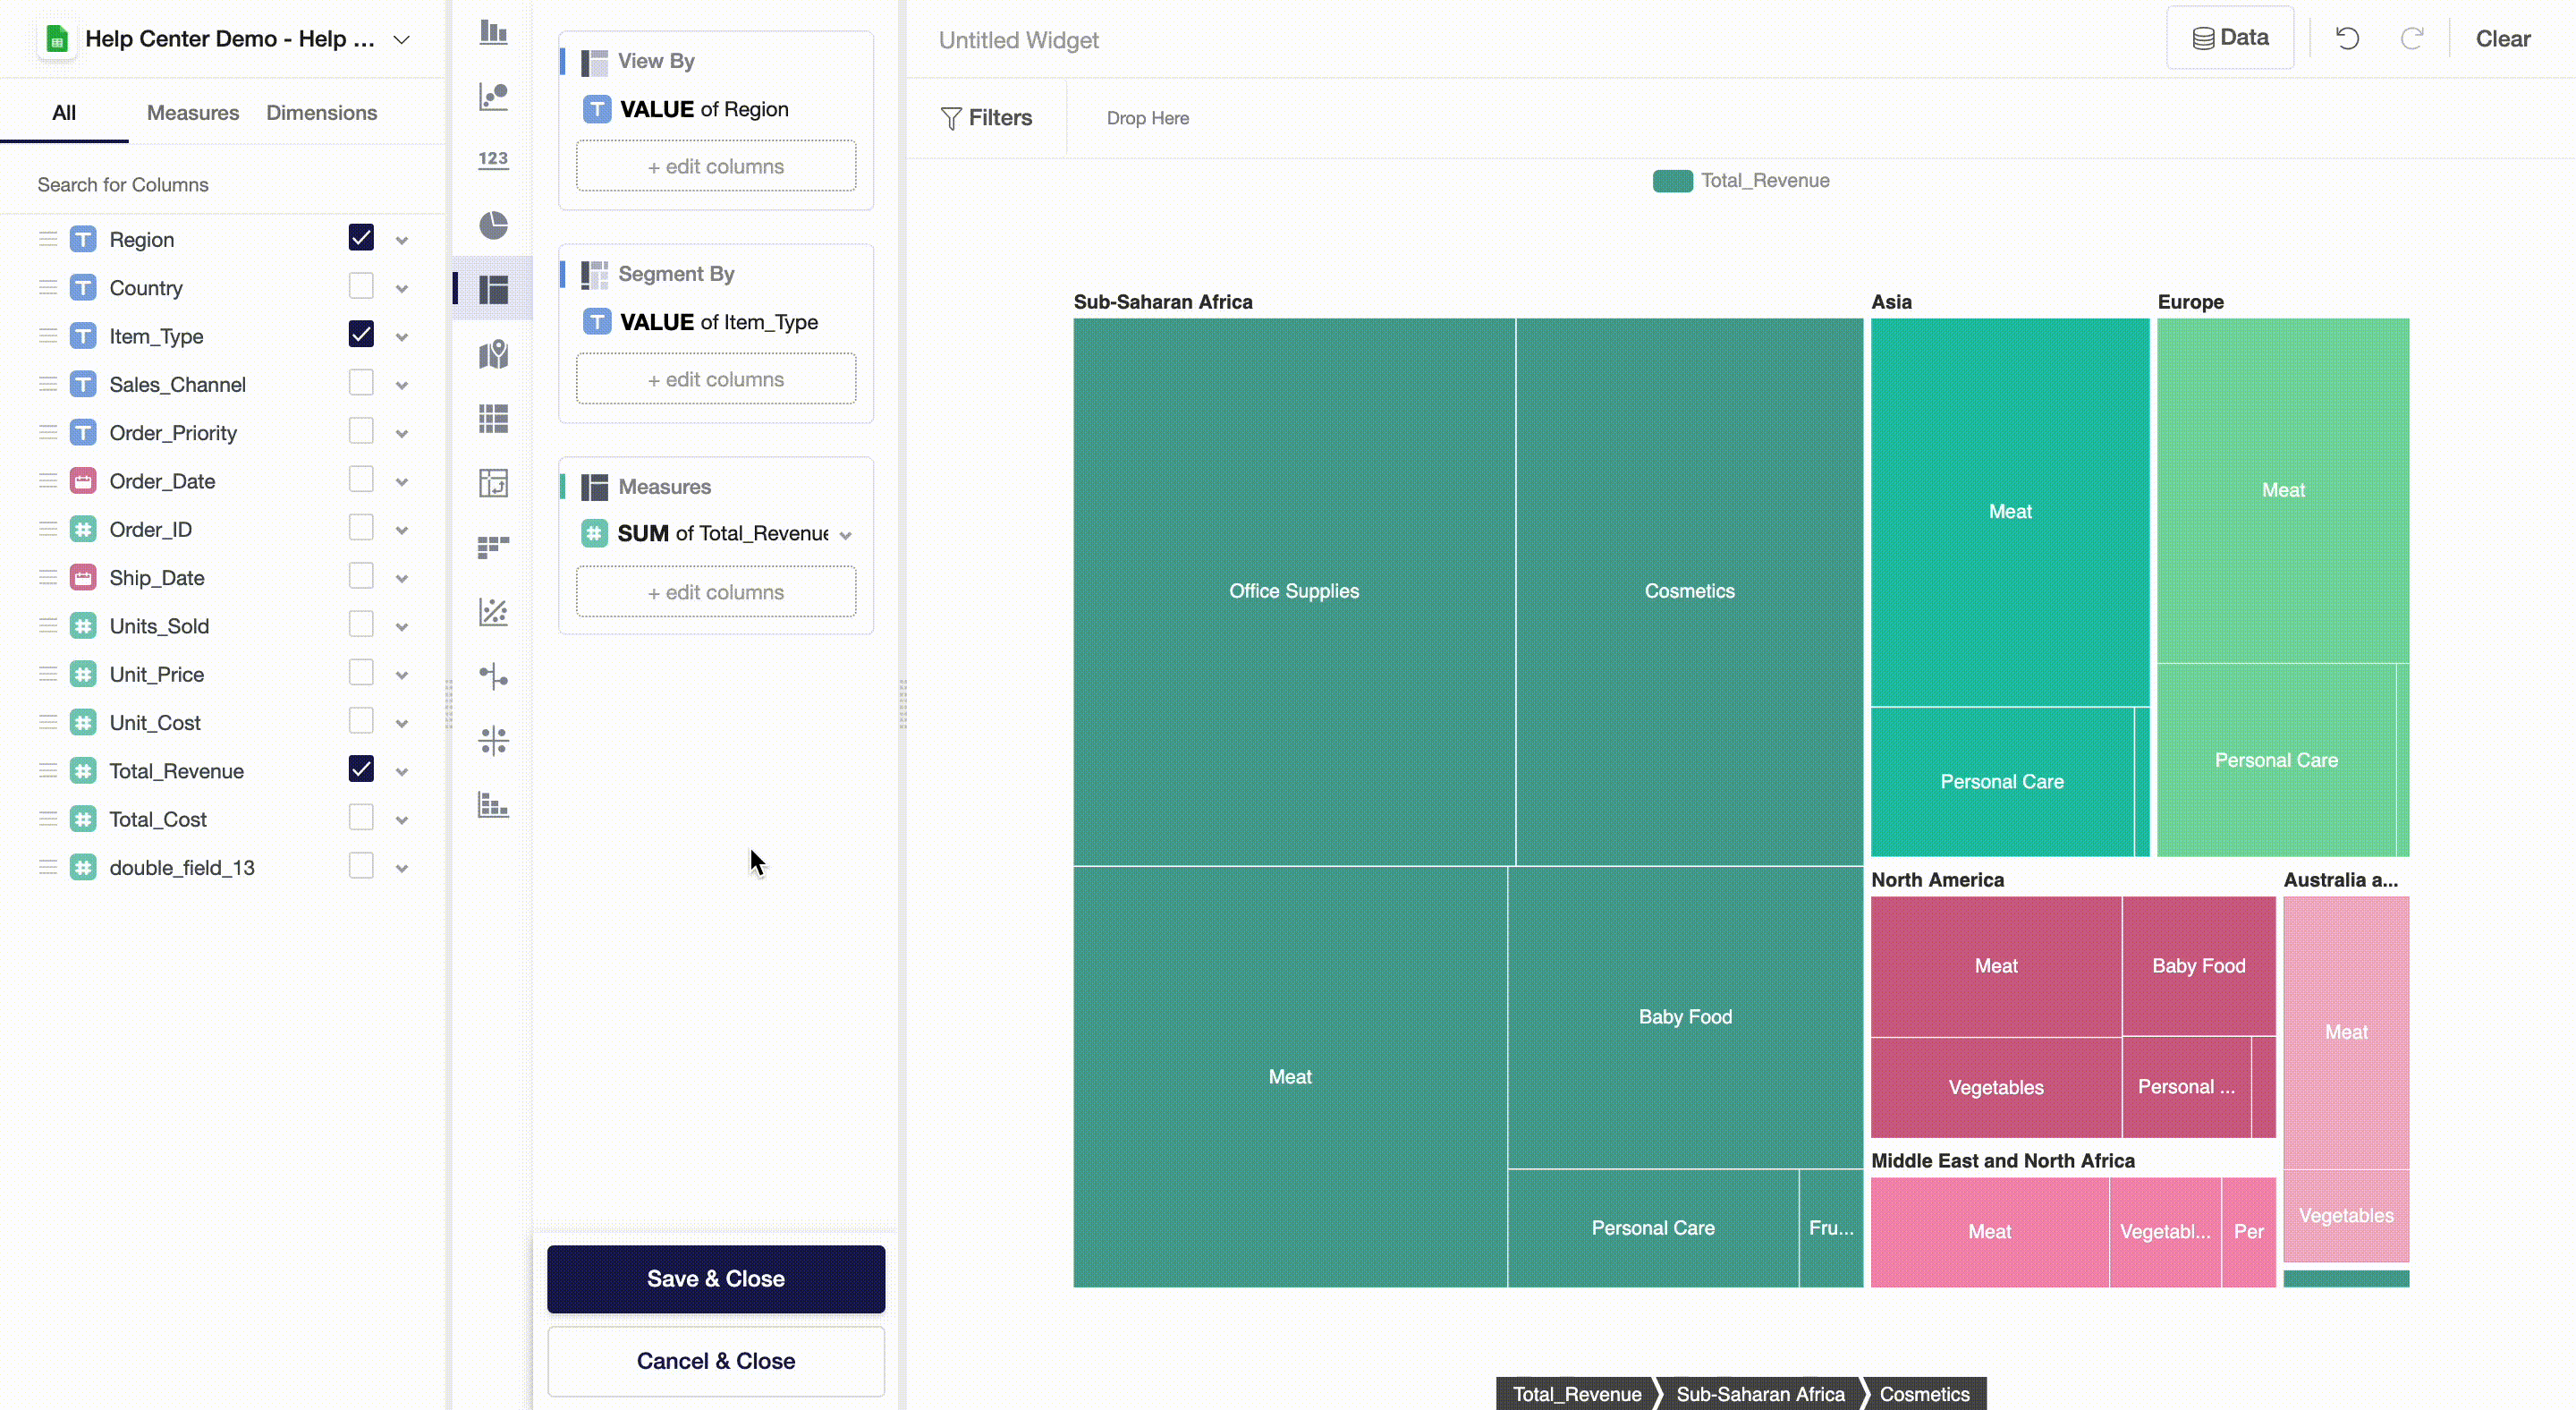
Treemaps are chart types used to display data in nested rectangles. By adding dimensions, you define the structure of a treemap, and measures to set the size of each rectangle. Treemaps are best suited for showing metrics by multiple categories or drill down to different levels of data granularity.
To create a treemap follow the next steps:
- Choose Treemap in the widget menu.
- Drag and drop numeric variables or metrics of your interest to Measures.
- Drag and drop a dimension to View By. This will split a measure into categories.
- Drag and drop a dimension to Segment By to split up a measure even further, within each category.
Aggregate Functions
By clicking on any of the aggregate functions highlighted by bold font, you can change any function you would like to apply. This will change how a treemap looks like: the larger the area, the higher the corresponding value of a measure within a given category.
Filters and Underlying Data
On a widget level, users can also set particular filters by dataset variables. To do so, you can drag and drop variables from the measures and dimensions field and then apply a filter to the variable you chose.
By clicking on Data, you will get a preview of the data used to build a widget.