Creating a Table
Adding tables into your dashboard is extremely helpful if you want to keep a close eye on your data. Additionally, grouping and filtering your data allows you to create the most insightful tables for your data. We will first go over how to create a basic table before we dive into more complex options.
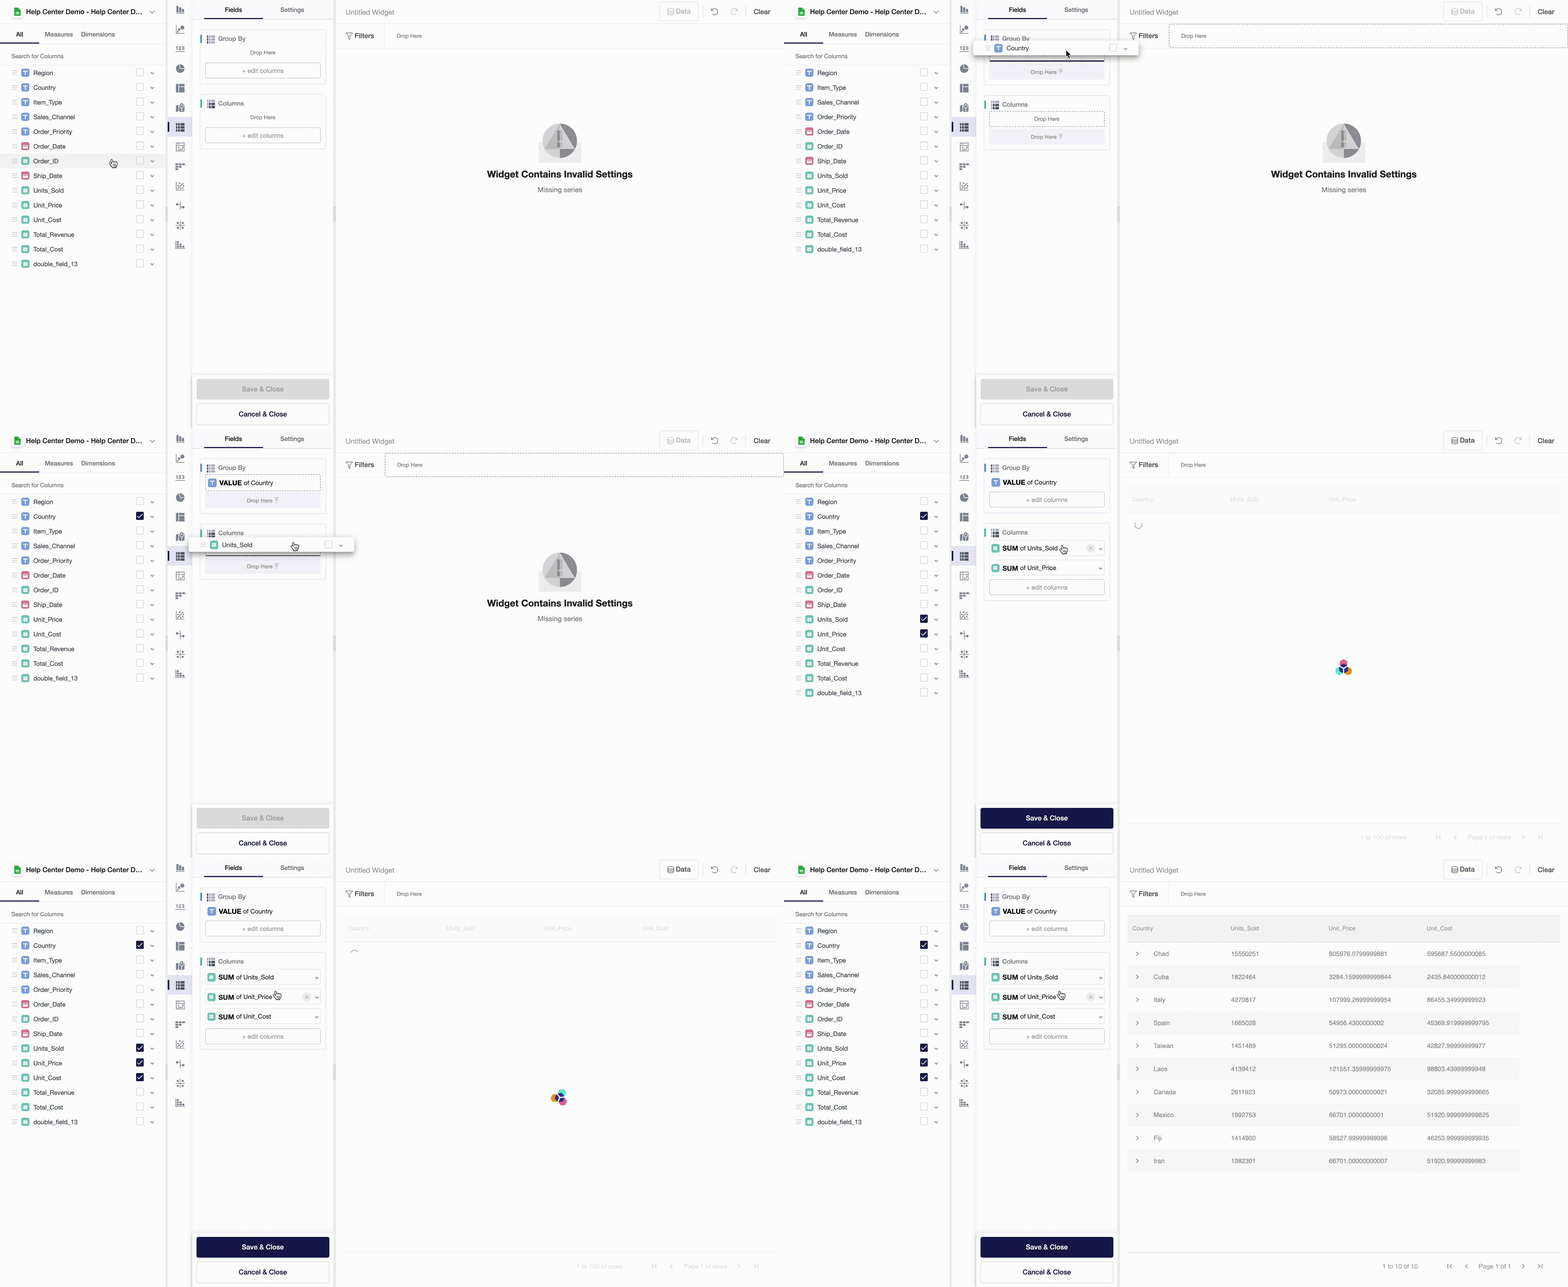
Follow the next steps to create a table:
- Choose Table in the widget menu.
- Drag and drop a dimension to Group By. It will set a data view granularity and determine how your values are grouped.
- Drag and drop measures to Columns to set up columns of your table.

Widget-Level Settings
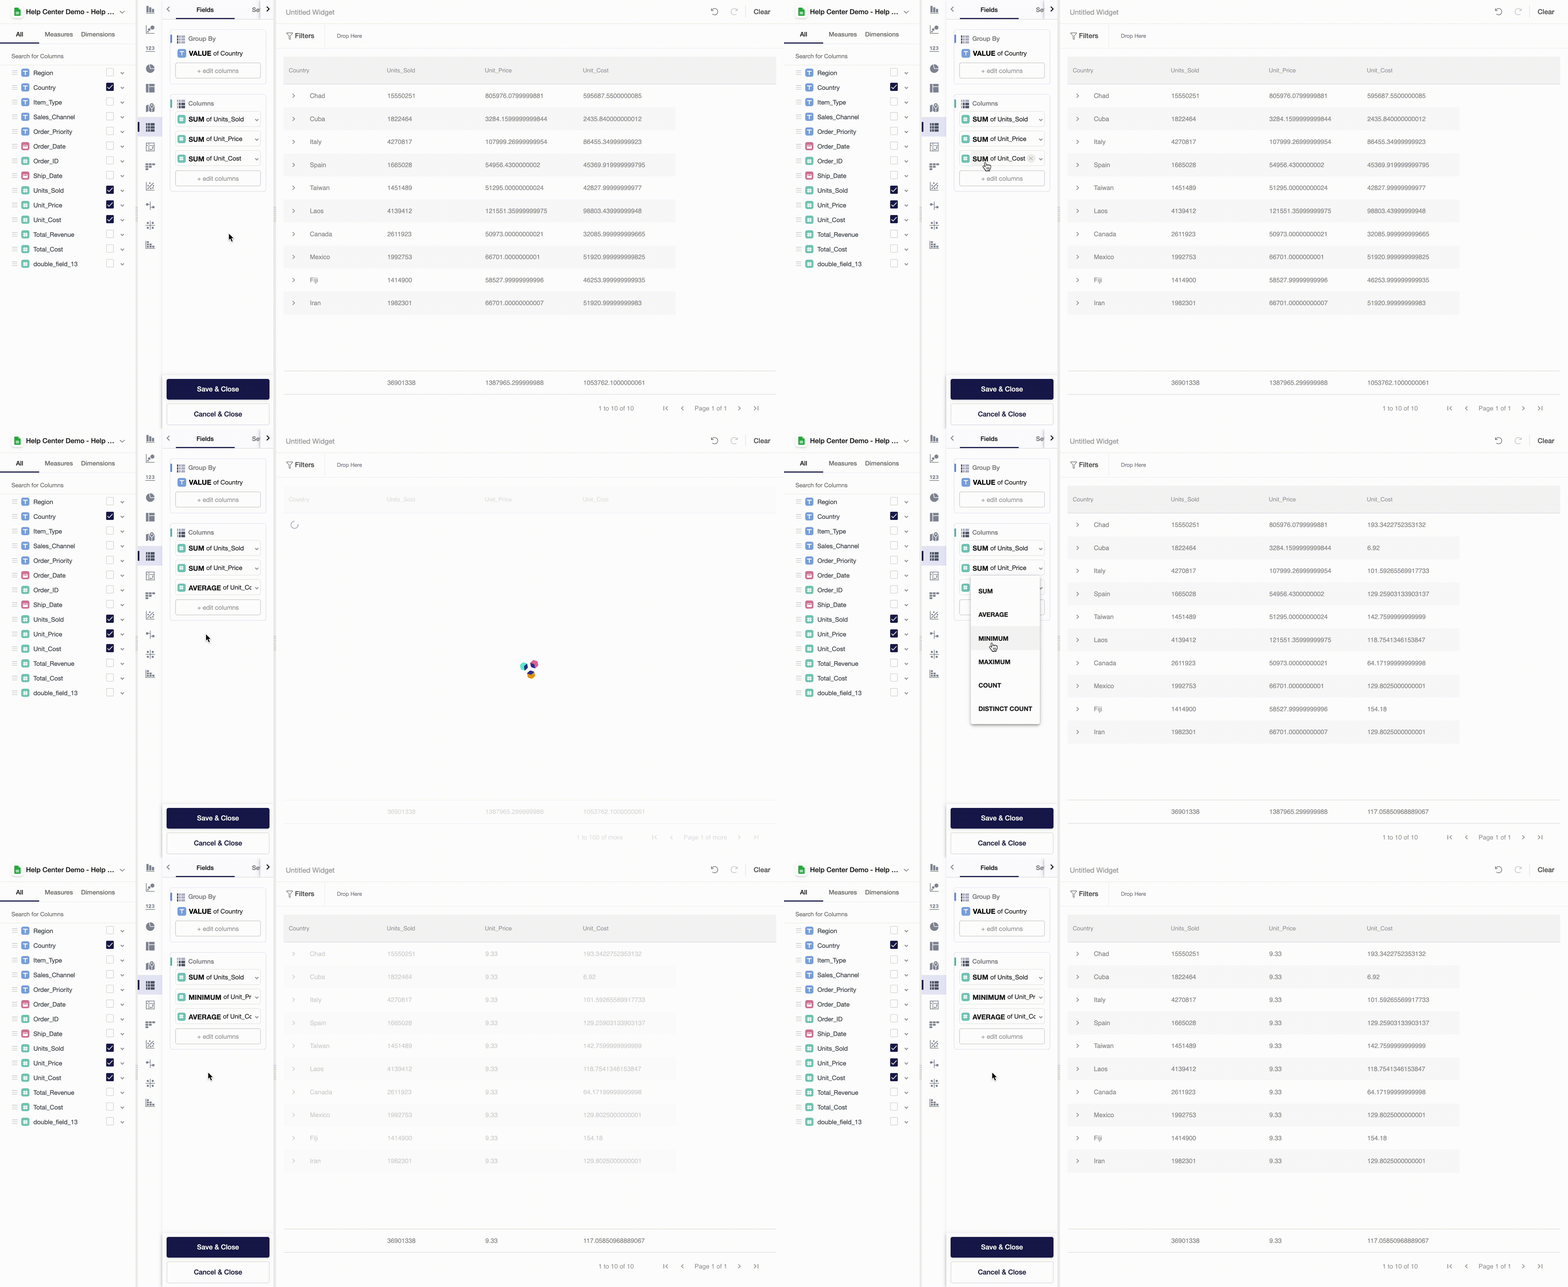
Currently, Y42 app supports multiple aggregate functions that you can apply to variables you use in your table. To change an aggregate function, simply click on bold text SUM and choose the most suitable function.

Filters and Underlying Data
On a widget level, users can also set particular filters by dataset variables. To do so, you can drag and drop variables from the measures and dimensions field and then apply a filter to the variable you chose.
Conditional Colouring - Beta
Editors can set the colour of individual cells in a table based on pre-defined criteria for a given field. This can be accessed from the settings area of the table builder.
Multiple rules can be applied to the same fields, with the earliest rule taking priority if the rules conflict.
Looking to create a Pivot Table instead? Read our article on Creating a Pivot Table.