How to analyze your Google Cloud costs
Y42 is built on top of cloud platforms in order to provide a cost-efficient, highly performant, and easy-to-maintain data platform. Currently, we are only supporting the hosting of Y42 on the Google Cloud. This article gives you a guide to analyzing your Y42-related cost on your Google Cloud.
How to analyze your Y42-related spend on Google Cloud
Step 1
Go to your Google Cloud console and select the Google Cloud project you are using to host Y42. Open up the navigation menu on the left side and go to the Billing section. On the Overview page you can have a glance at your current month's cost and an estimate for end-of-month total cost.
Step 2
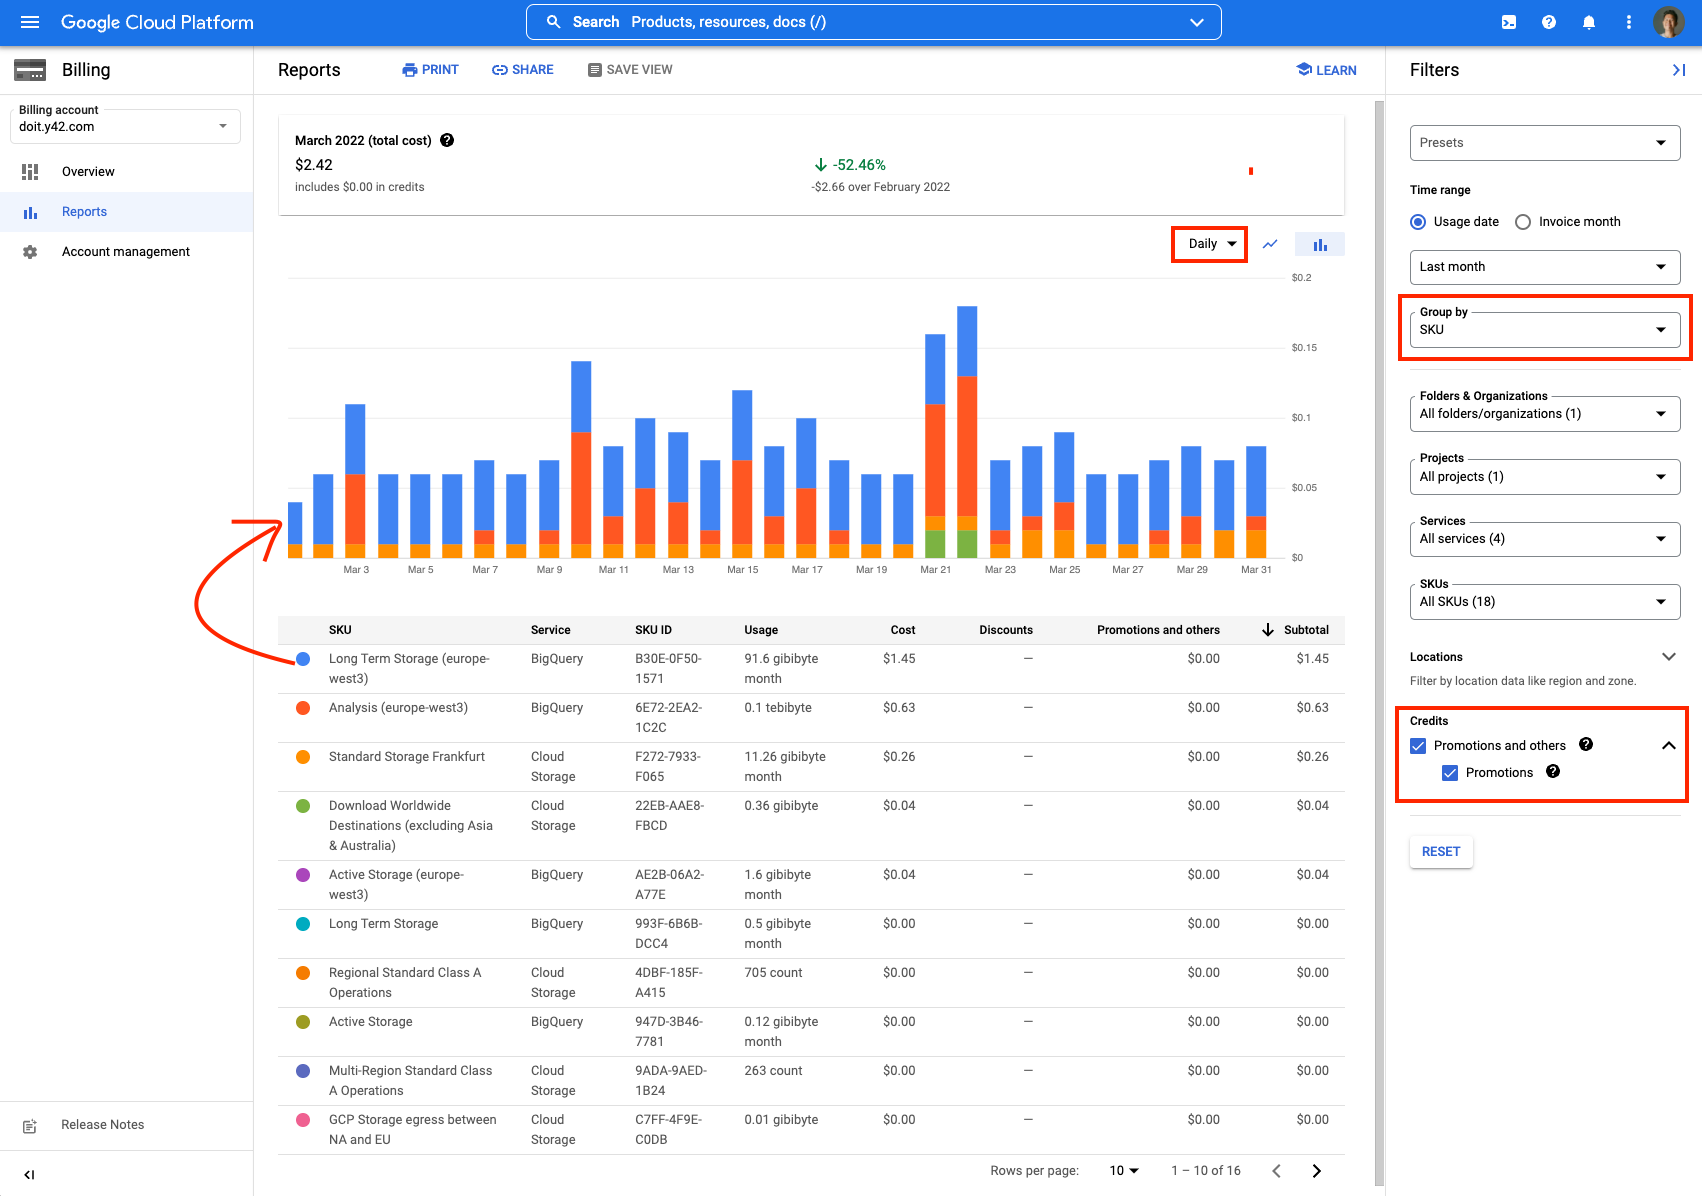
In order to dig deeper into Google Cloud costs, go to the Reports section. In this workspace, you can break down your Google Cloud cost by SKU, project, service or location. Just adjust the granularity by selecting a different "Group by". To analyze the development of your cost you can adjust the time range and also change the view to daily or monthly.
Optionally, you can also decide to include or exclude the used promotion credits.
Step 3
The only Google Cloud services that are "used" by Y42 are Google BigQuery and Cloud Storage. If the majority of your costs are located in storage services, then your costs are driven by integrations. If the majority of your costs are located in analysis, then your costs are driven by your models.
How to check out which jobs are producing the most data in Y42?
Every job and data process triggered in Y42, eventually, is processed in Google BigQuery. To identify which job in Y42 is actually producing the most data, you can follow these steps:
Step 1
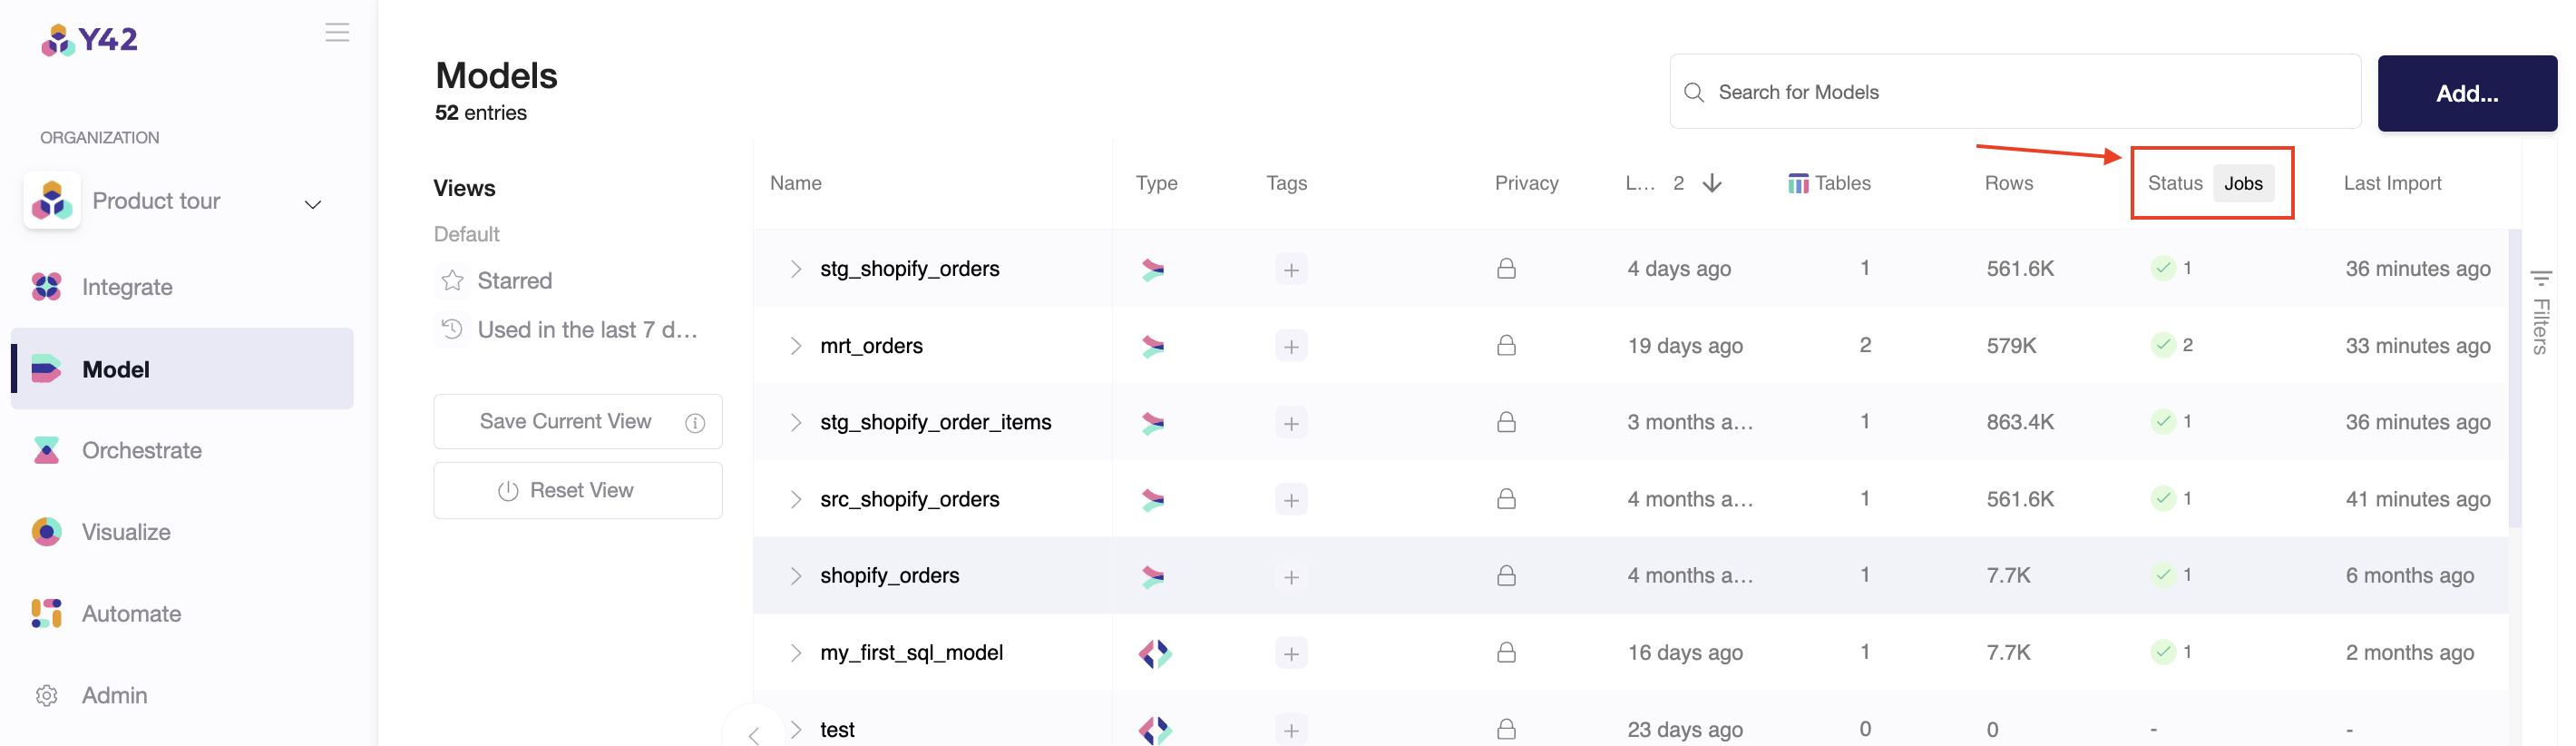
Click on the Jobs button inside the Integration or Modeling workspace.
Step 2
Analyze the data size and amount of data your jobs in Y42 by grouping the jobs by Type, Data Source and Table:
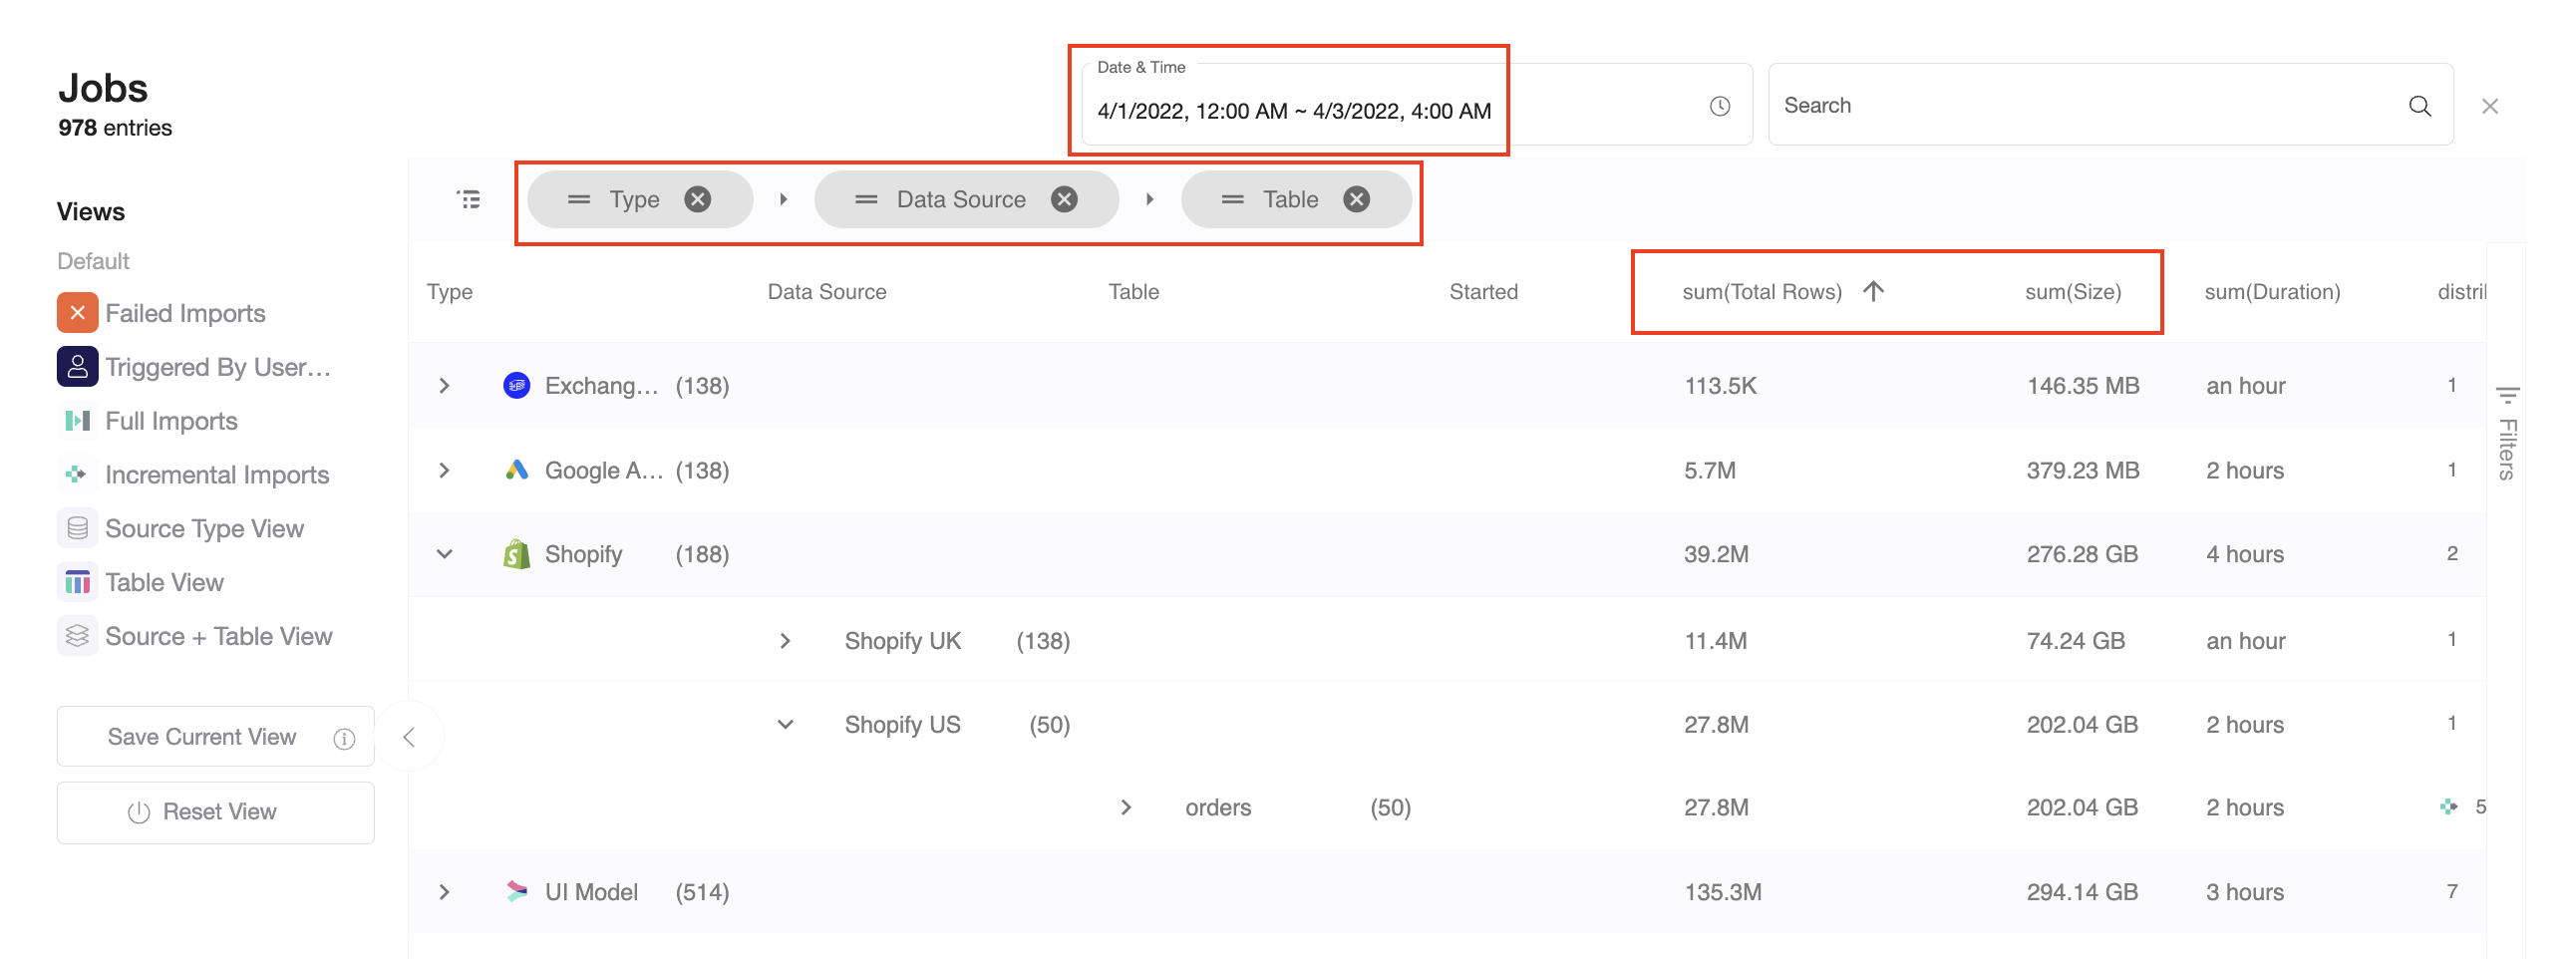
Please note: You can currently only analyze 5.000 jobs at a time. If you have more, please select a smaller time window.
How to reduce your Google Cloud costs?
- Reduce the frequency of updates. In your orchestration overview, you can set the update frequency for each of your pipelines. If you run an orchestration only half as often, this orchestration will also produce half as much costs in your Google Cloud account.
- Reduce the amount of historical data. If you process all your historical data with every run, you create a lot of spend on BigQuery. You could adjust your reports to use less of your historical data for every run. You could also combine this with the update frequency to produce reports that include all your historical data once a week and only use a small part of your historical data for your intra-day reports.
- Refactor your data pipelines. The way you model also has a big impact on Google Cloud costs. For example, if you aggregate very large tables earlier in your data pipeline, it will reduce your BigQuery spend.